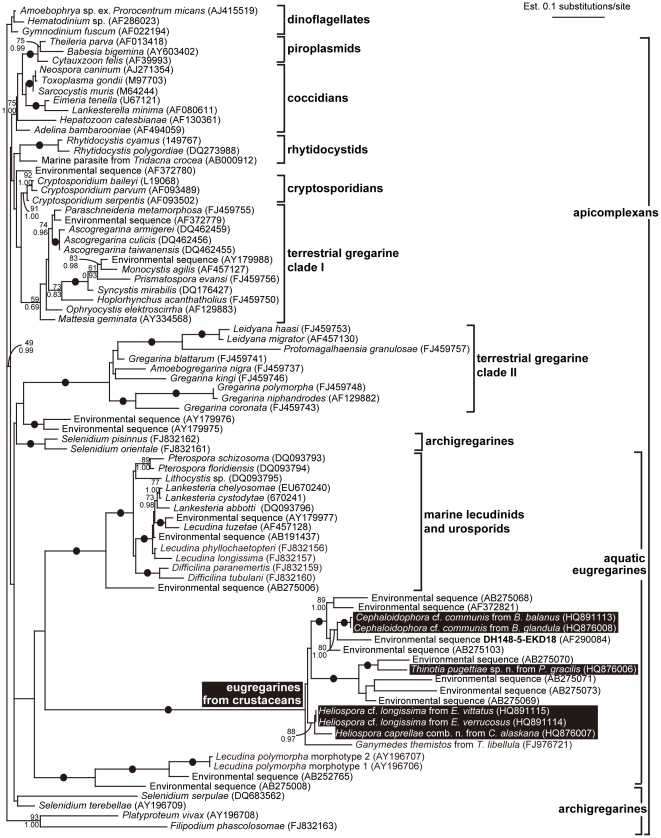
Figure 6. Maximum likelihood (ML) tree of apicomplexans inferred using the GTR + Γ + I model of substitution on an alignment of 82 small subunit (SSU) rDNA sequences and 1,006 unambiguously aligned sites (-ln L = 17763.96233, α = 0.514, proportion of invariable sites = 0.099, eight rate categories).
Numbers at the branches denote ML bootstrap percentage (top) and Bayesian posterior probabilities (bottom); values provided are higher than 65% (i.e., the absence of values reflect statistical support below 65%). Black dots on branches denote Bayesian posterior probabilities and bootstrap percentages of 95% or higher. The six sequences derived from this study are highlighted with black boxes.

