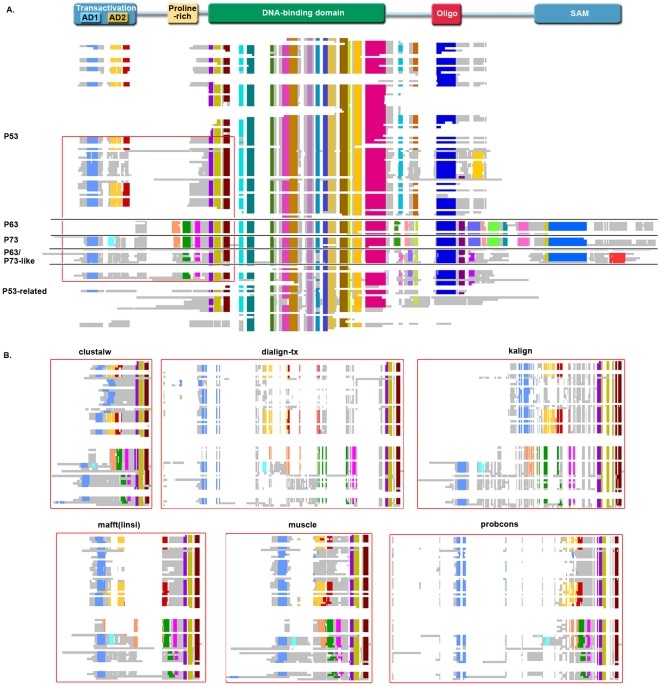
Figure 1. An example benchmark alignment.
(A) Reference alignment of representative sequences of the p53/p63/p73 family, with the domain organization shown above the alignment (AD: activation domain, Oligo: oligomerization, SAM: sterile alpha motif). Colored blocks indicate conserved regions. The grey regions correspond to sequence segments that could not be reliably aligned and white regions indicate gaps in the alignment. (B) Different MSA programs produce different alignments, especially in the N-terminal region (boxed in red in A) containing rare motifs and a disordered proline-rich domain.

