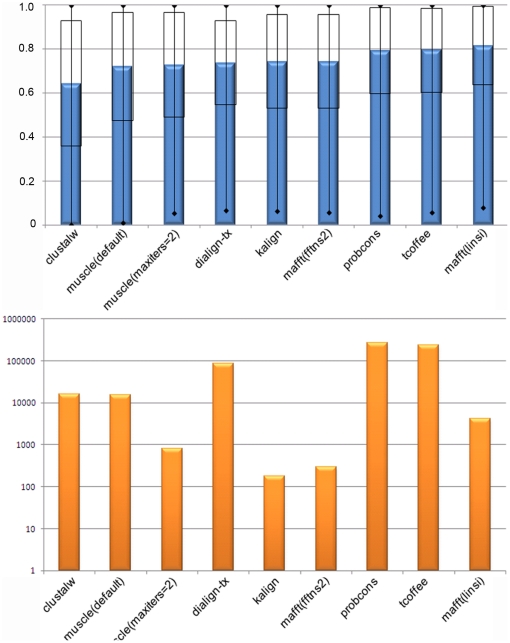
Figure 3. Overall alignment performance for each of the MSA programs tested.
(A) Overall alignment quality measured using CS. Programs are shown ranked by increasing quality scores. Error bars correspond to one standard deviation.(B) Total run time for constructing all alignments (a log10 scale is used for display purposes).

