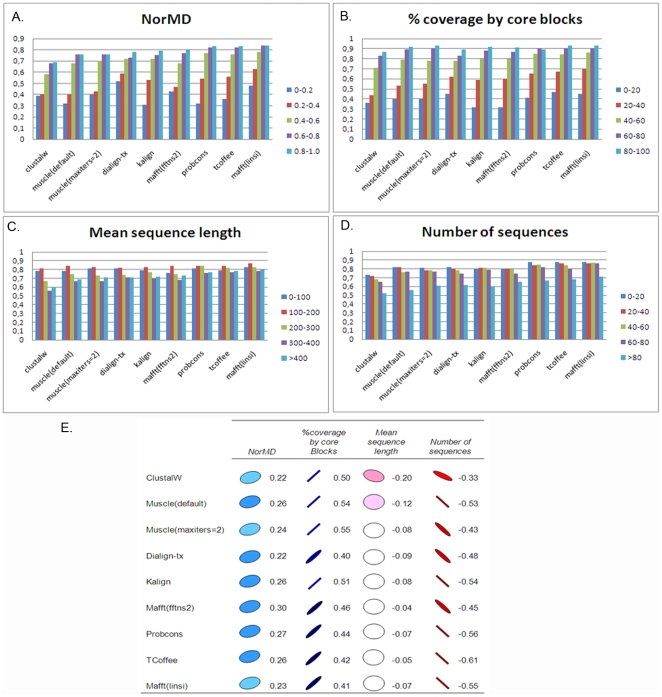
Figure 4. Factors affecting overall alignment quality.
Average alignment quality scores (CS) for each MSA program tested and for eachglobal alignment attribute:(A) CS versus NorMD, (B) CS versus the percentage of the alignment covered by the blocks, (C) CS versus mean sequence length, (D) CS versus the total number of sequences.(E) Pearson correlation coefficients of overall quality scores (CS) for each program with global alignment attributes (blue: positive correlation, red: negative correlation).

