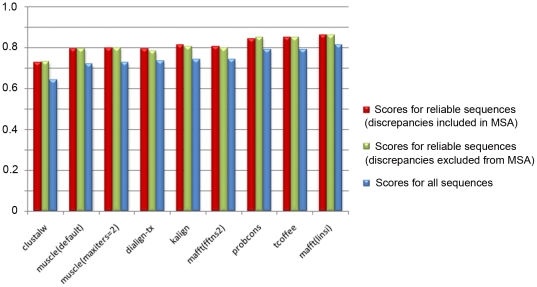
Figure 5. Comparison of alignment quality scores for sequence sets with and without potential error sequences.
Quality scores (CS) for alignment of reliable sequences when discrepancies are included in the alignment set are shown in red. Quality scores for the same set of sequences when discrepancies are removed from the alignment set are shown in green. Scores for all sequences (from figure 2) are shown (in blue) for comparison purposes.

