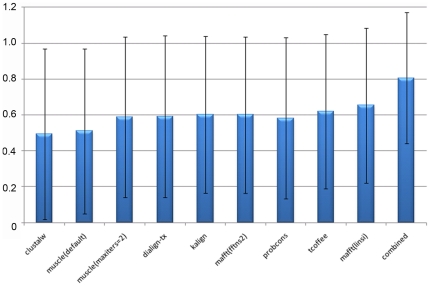
Figure 7. Comparison of block scores obtained by the different alignment programs.
Mean block scores for the individual programs vary between 0.49 and 0.65. Combining the results from each program leads to an increased mean score of 0.81.Error bars correspond to one standard deviation. Asterisks indicate significant differences between the scores according to pairwise t-tests (significance level 0.05).

