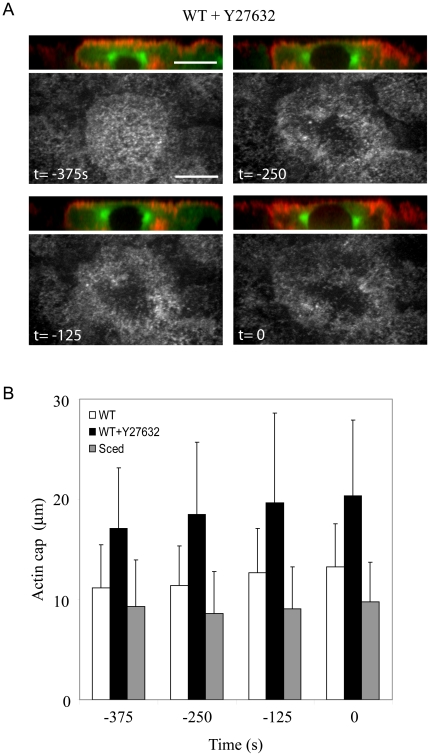
Figure 4. Quantification of the actin cap size.
A) Side views of actin, nucleus and centrosomes (rhodamine-actin, red; GFP-Tubulin, green) and corresponding top views of actin in prophase WT embryos in the presence of the myosin inhibitor Y27632 reveal that the centrosomes segregate around the nucleus, likely being pulled outward by the increasing forces. The resulting vertical component of the force pushes the nucleus upward against the actin cap thinning the cortex and creating the ‘hole’. NEB is t = 0 s. Bars, 10 µm. B) The square root of the actin cap areas as functions of time (NEB is t = 0 s) in WT embryos in the absence and presence of the myosin inhibitor Y27632 and in the Sced embryos.

