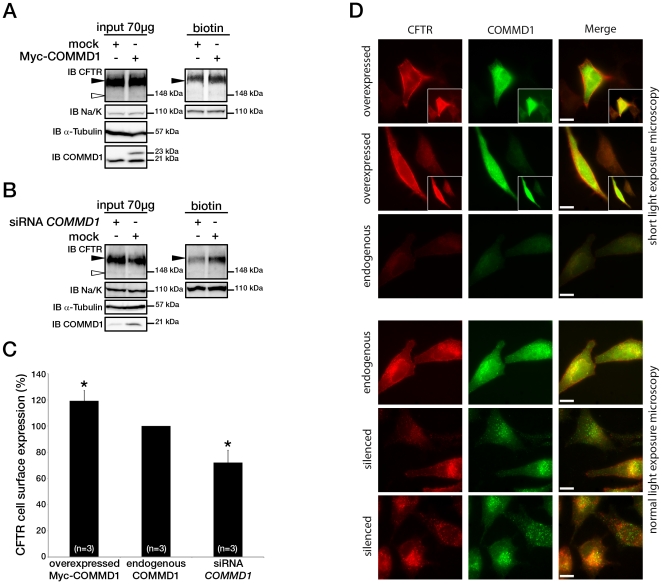
Figure 2. COMMD1 regulates CFTR cell surface expression.
(A) HeLa cells stably expressing wt-CFTR were transiently transfected with an empty COMMD1 vector (mock, pcDNA3.1/Topo) or Myc-COMMD1, and were biotinylated with Sulfo-NHS-LC-biotin. Lysates from all these experiments were subjected to SDS-PAGE directly (input) or pulled-down with streptavidin-agarose (biotin). Representative gels for the same samples were separated by 8% SDS-PAGE for CFTR, Na/K-ATPase detection and 11% SDS-PAGE for COMMD1, α-tubulin detection. (B) HeLa cells stably expressing wt-CFTR were transiently transfected with a siCONTROL Non-Targeting siRNA (mock) or COMMD1 siRNA and further processed as in (A). Filled and empty arrowheads indicate the fully- (170 kDa) and core-glycosylated (140 kDa) CFTR, respectively. (C) Quantification of CFTR cell surface expression. The biotinylated CFTR level is normalized to the biotinylated Na/K-ATPase level. Endogenous COMMD1 expression is referred as 100%, with mock being pcDNA3.1/Topo for overexpression experiments (A), whereas mock was siCONTROL for silencing experiments (B). The means ± S.D. were obtained from three independent experiments.* P<0.05 was determined by t-test. (D) Immunofluorescence microscopy of COMMD1 and CFTR in HeLa cells stably expressing wt-CFTR. Cells were transfected with Myc-COMMD1 or COMMD1 siRNA for overexpression and silencing studies, respectively, and not transfected for endogenous expression studies. Two types of light exposure microscopy (short and normal) are shown to visualize all expression conditions. Scale bars: 10 µm.

