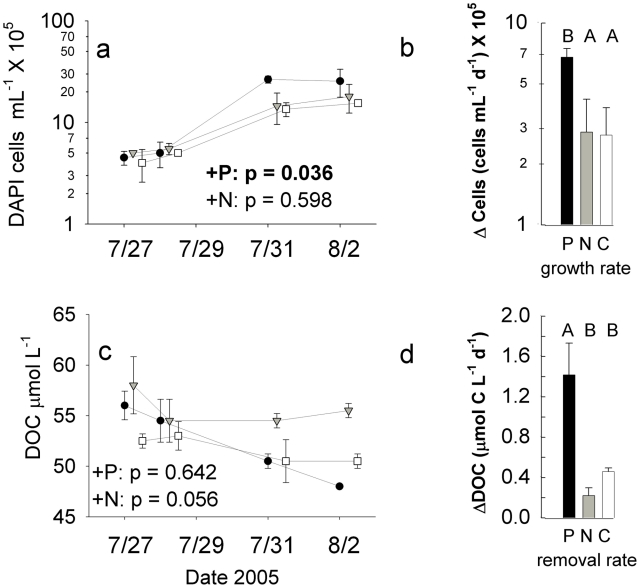
Figure 1. Bacterioplankton abundance and DOC concentration changes over the course of the DARK experiment.
Panels (a) and (c) show temporal responses among treatments, and RM-MANOVA p-values are presented for between-subjects treatment effects comparing each nutrient enrichment treatment with the Control, with treatment effects deemed significant and highlighted in bold if p<0.05. Letters denote significant differences between treatment means by Tukey-Kramer post hoc test at p<0.05. Panels (b) and (d) show rates of change in cell densities and DOC concentrations compared among treatments. Symbols are as follows: • = K2HPO4 additions (+P); ▾ = KNO3 additions (+N), □ = Control treatments. Error bars are ±1 standard deviation for two replicate microcosms for each treatment. Timepoints are offset for clarity.

