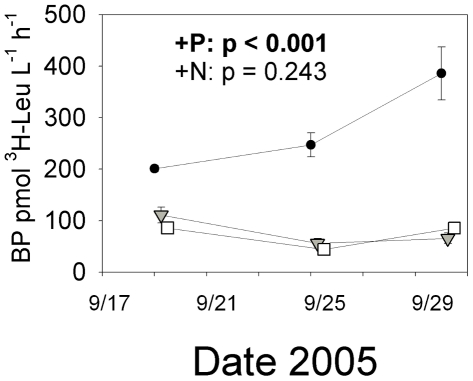
Figure 2. 3H-leucine incorporation over the course of the LIGHT experiment.
Statistics and symbols as for Fig. 1. Within-subjects effects (time and time X treatment) were significant for 3H-leucine incorporation (p<0.01). Symbols are as follows: • = K2HPO4 additions (+P); ▾ = KNO3 additions (+N), □ = Control treatments. Error bars are ±1 standard deviation for three replicate microcosms for each treatment. Timepoints are offset for clarity.

