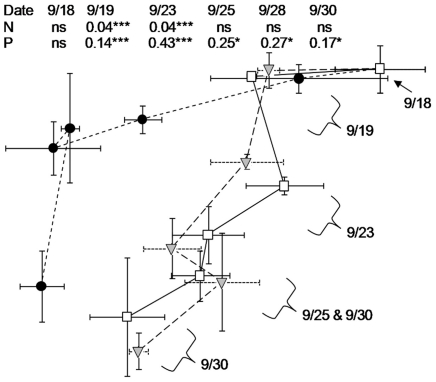
Figure 4. NMS ordination plots of changes in bacterial community composition during the LIGHT experiment.
Sampling dates are labeled according to their ordination position using brackets and arrows; lines connecting points follow the temporal trajectory. Results of MRPP comparing significance of each enrichment with the control on each date are presented as tables: values are effect size A, the chance-corrected within-group agreement for each treatment (A = 1 when all members of a group are identical; A<0 indicates more within-group heterogeneity than expected by chance) with significance tests represented as *p<0.05, **p<0.01, ***p<0.001, ns = [A<0 and p>0.05]. The DARK experiment (not shown) exhibited similar differences between P and Control treatments after the third day but no difference between N and Control treatments at any timepoint. Symbols are as follows: • = K2HPO4 additions (+P); ▾ = KNO3 additions (+N), □ = Control treatments. Error bars are ±1 standard deviation for replicate microcosms for each treatment.

