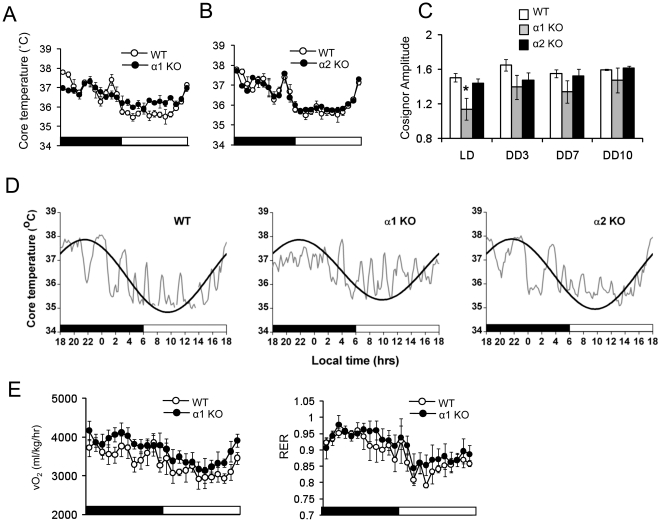
Figure 4. Disruption of circadian physiology in AMPKα-deficient mice.
(A,B) Core body temperature was measured by telemetry. AMPKα1−/−, AMPKα2−/− and WT mice were monitored in LD for 7 days followed by DD for 14 days. Representative data (mean ± SE) is LD day 7. Lights on is indicated by a white bar and lights off is indicated by a black bar. The same WT data is plotted in A and B. (C) Amplitude calculated from cosinor analysis of WT, AMPKα1−/− and AMPKα2−/− mice in LD, DD day 3, 7, 10. Results are expressed as mean ± S.E. * P<0.05 between WT mice versus AMPKα1 deficient mice (n = 3–5 for each genotype). (D) Cosinor analysis of core temperature for WT, AMPKα1−/− and AMPKα2−/− mice. The cosine curve (black line) is superimposed on core temperature raw data (gray line). A representative plot is shown for each genotype (E) VO2 (left) and RER (right) in AMPKα1−/− and WT mice. Average data is shown under LD on day 7. Light on is indicated by a white bar and light off is indicated by a black bar (n = 4 for each genotype).

