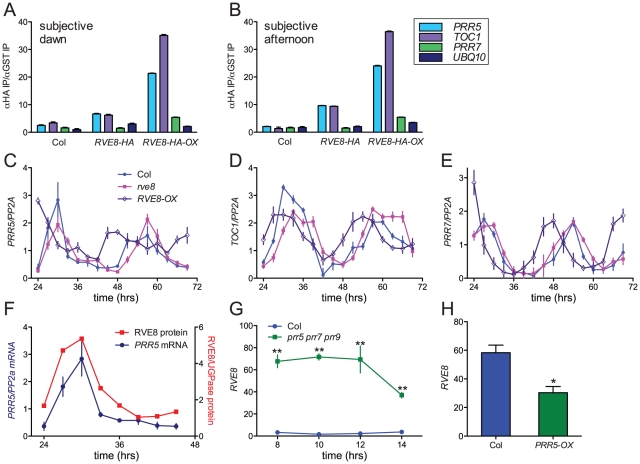
Figure 8. RVE8 and PRR5 form a negative feedback loop.
(A, B) RVE8 binds to promoter regions containing EE motifs. Col, rve8-1 + RVE8::RVE8-HA and rve8-1 + 35S::RVE8-HA seedlings were entrained in white light/dark cycles for six days before release into continuous red light (35 mol m−2 sec−1). Plants were harvested at ZT48 (A) or ZT 32 (B); chromatin immunoprecipitations (IPs) were carried out using anti-HA and anti-GST antibodies. qRT-PCR was performed using primers that amplify the EE-containing regions of the PRR5 and TOC1 promoters and the CBS-containing region of the PRR7 promoter; primers that amplify a portion of the UBQ10 locus were used as a background control. The ratios of the amount of DNA isolated in the anti-HA IPs vs. the control anti-GST IPs are presented. (C–E) Expression of clock-associated genes in Col, rve8-1 and RVE8-OX. Plants were entrained as described for panels A–B and samples were harvested at the indicated times. Expression of PRR5 (C), TOC1 (D), and PRR7 (E) was determined using qRT-PCR. Values are expressed relative to PP2a. Similar results were obtained in two independent experiments. (F–H) Regulatory interactions between RVE8 and PRR5. (F) Relative abundance of RVE8 protein and PRR5 mRNA (re-plotted from Figure 4B and Figure 8C). (G) RVE8 transcript levels are elevated in prr5 prr7 prr9 mutants; data are derived from previously-published microarray data [84], [85]. (H) RVE8 transcript levels are reduced in plants expressing PRR5 under the control of the strong viral 35S promoter. Data are derived from microarray data available at NASC (submitted by Hitoshi Sakakibara; NASCArrays experiment reference number NASCARRAYS-420). ** indicates p<0.01 and * indicates p<0.05; Student's two-tail heteroscedastic t test. Error bars represent ± SE.

