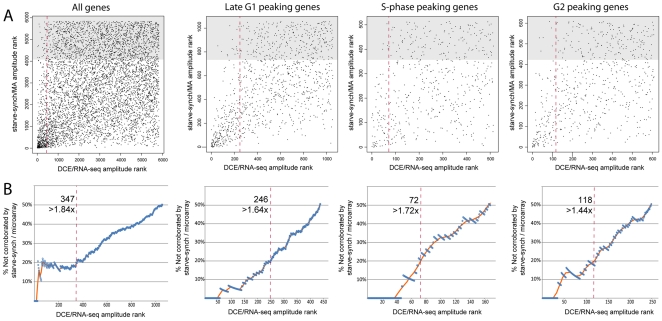
Figure 3. Comparison of genes ranked by regulation amplitudes, between cells synchronized by DCE-selection (RNA-seq) or starvation (microarrays).
A: Genes were plotted according to their regulation amplitude rank within each dataset, such that the most highly regulated gene was ranked as #1 and so on. Only genes peaking at equivalent times between the two experiments were plotted in the right three panels; all genes were plotted in the left panel. Genes ranking in the least-regulated one-third of the starve-synch dataset (shaded area) were assumed to be representative of genes whose regulation in the DCE experiment was not corroborated by the starve-synch experiment. Red line: 20% non-corroboration threshold derived in B. B: A threshold gene-rank in the DCE/RNA-seq dataset (horizontal axis) was varied incrementally and the number of non-corroborated genes inside this cut-off rank was estimated as three times the number of the included genes that were also in the lowest-ranked one-third of the MA data (A; shaded area). For each cut-off rank, the percentage of included non-corroborated genes was estimated (blue circles) with a moving average (orange line). The red dashed line (A and B) indicates the point at which 20% of discovered genes (i.e. to the left of the line) were non-corroborated; the number of genes included using this cutoff rank is indicated. This could be an over-estimation of the false-discovery rate, as genuinely regulated genes might not be detectably regulated in the starve-synch experiment due to differences in the experimental setup.

