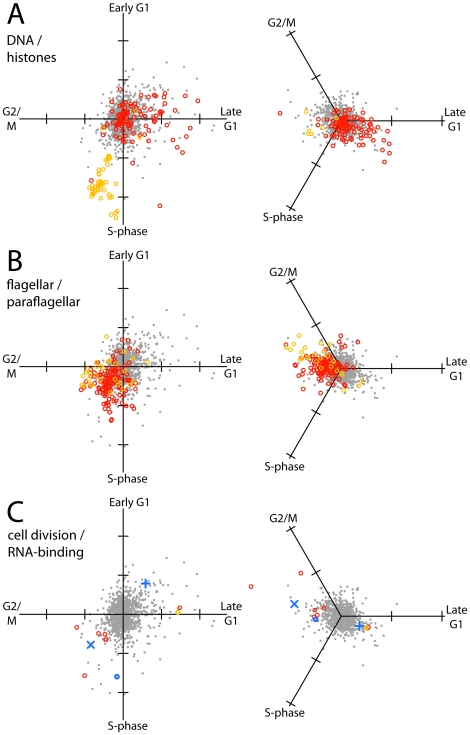
Figure 5. Vectorial representation of regulation of selected functional groups of transcripts in the cell cycle, from DCE/RNA-seq data (left panels) or starve-synch/microarray data (right panels).
Each time-point in the cell cycle that was analyzed was arranged as a vector pointing outwards from the origin. Gene expression values were plotted by vector addition; tick marks on axes are one log2 unit. Reference profiles from 1000 randomly selected genes are plotted in grey; genes in specific functional groups are plotted as coloured circles. A: Red: Transcripts annotated with “DNA” in “product description” or in gene ontology fields of the TriTryp database (relevance score >40). Orange: Histone-encoding transcripts. B: Red: Transcripts encoding flagellar proteins [32]. Orange: Transcripts encoding Snl2-dependent paraflagellar rod proteins [33]. C: Putative mediators of mitosis and cytokinesis, and RBPs. Red: Transcripts encoding Aurora kinases and chromosomal passenger complex proteins. Orange: Polo-like kinase. Blue: Selected RBPs. (×) PUF9, (+) RBP45 homologue, (o) DRDB17.

