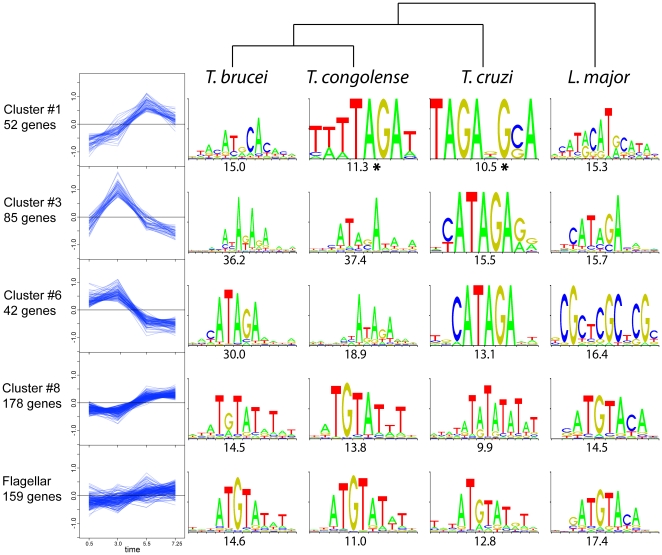
Figure 6. Identification of over-represented sequence motifs among selected clusters of co-regulated transcripts.
Cluster expression profiles from DCE/RNA-seq data are plotted on the left, with the log2 expression values on the y axis and time on the x axis. The top-ranking over-represented sequence motifs from UTR sequences in four kinetoplastid species, as found using Trawler, are presented on the right with the z-score below. (*) indicates motifs supported by MEME analysis of Cluster #1 (see Table S5). Top: a dendrogram showing the phylogenetic relationship between species.

