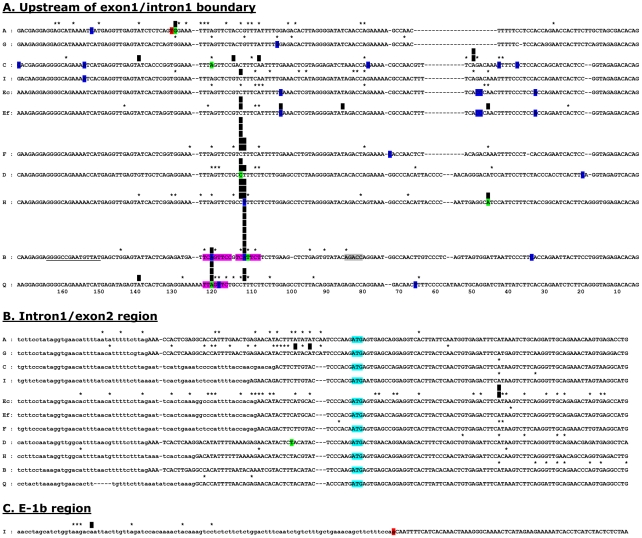
Figure 1. Transcriptional start sites in Ly49 genes.
The start sites of cap-trapper 5′RACE cDNAs are plotted onto gene sequence alignments of the region upstream of the exon1-intron1 boundary (A), the region surrounding the intron1-exon2 boundary (B), and exon-1b (C). Exonic regions are shown in upper case letters, intronic regions in lower case letters. In the case of the Ly49I exon-1b region, the distinction is artificial as the intronic region ends with a defective splice signal (highlighted in red). Black vertical bars mark sites at which >10% of all transcripts for a given gene originated, the number of bars indicating the actual percentage in units of 10% (eg. 3 bars = 30–40% of all transcripts). Asterisks show other TSSs in these regions. A small number (<5%) of TSSs mapped outside of these egions (see text) and are therefore not shown on the diagram, but are included in the analysis in Table 1. Bases highlighted in blue or green are the TSSs of cDNAs deposited in Genbank, those in green being from the Riken CAP-trapper high efficiency cDNA cloning project. The red T in Ly49A is the TSS for Ly49A in EL4 cells determined by Kubo et al [16] using primer extension and nuclease protection. Regions highlighted in purple in Ly49B and Ly49Q correspond to canonical Inr sequences, the grey region in Ly49B corresponding to a perfectly positioned canonical DRE sequence, and the underlined bases in Ly49B corresponding to GC and TA rich regions with similarity to BRE and TATA sequences [46]. For 9 of the 10 genes, the general disposition of TSSs in fresh cells was not different to that in cultured cells (see Table 1), and the data has therefore been combined. However, for Ly49E the results obtained from fresh cells (Ef) and cultured cells (Ec) were markedly different and are therefore plotted separately.

