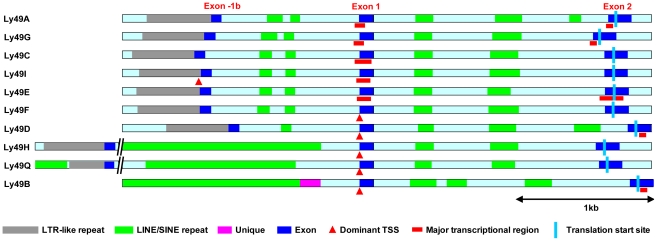
Figure 2. Structure of the upstream region of Ly49 genes.
The diagram shows the ∼3.5–6 kb region that extends upstream from exon 2 to just beyond the LTR-like repeat sequence that precedes exon -1b (except for Ly49B that lacks a recognizable exon -1b). Exons are shown in dark blue, homologous intronic regions in light blue, LINE/SINE repeats in green, LTR-like repeats in grey, and unique sequence in purple. Dominant TSSs are shown by red triangles, broad transcriptional initiation regions by red bars, and the translational start site by a pale blue line.

