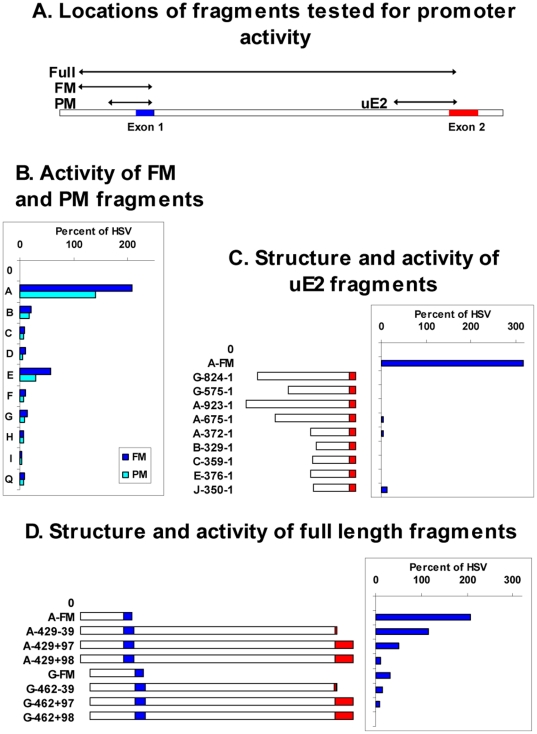
Figure 4. Promoter activity of Ly49 gene fragments in EL4 cells.
A. Schematic diagram of the gene fragments tested for promoter activity, namely the PM and FM fragments from the upstream region, the uE2 fragments from the region upstream of exon 2, and the full length ∼2.3 kb fragments that run from the start of the FM fragments to various positions around the start of exon 2. B–D. The RMA/E3 subline of EL4 cells was transfected with pGL4 plasmids containing no insert (0), the HSV promoter, or various Ly49 gene fragments, as follows: B. FM (dark blue bars) and PM (light blue bars) fragments from the upstream region of the Ly49 genes shown. C. The Ly49A FM fragment or fragments of various length extending upstream from the translational start codon in exon 2 of various Ly49 genes. Numbers show the distance of the start and end of each fragment from the start codon, and the diagrams provide a graphical representation of the fragments with intron 1 unshaded and exon 2 in red. D. The FM fragments from the Ly49A and Ly49G genes, or “full length” fragments of various length beginning at the same upstream position as the FM fragments and ending at various positions in exon 2. Numbers show the distance of the start point from the exon1/intron1 boundary, and the distance of the end point from the translational start codon, a negative value meaning upstream and a positive value meaning downstream of the start codon. In the +97 constructs the Ly49 start codon would be in frame with the luciferase start codon, in the +98 constructs it would be out of frame. The diagrams show a graphical representation of the fragments with exon 1 in blue, intron 1 unshaded, and exon 2 in red. In all cases, luciferase activity is expressed as a percentage of that observed with the HSV promoter.

