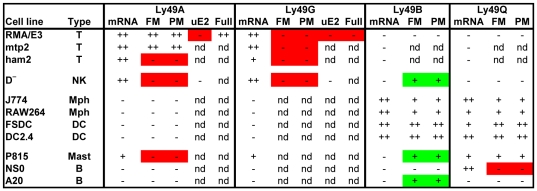
Figure 8. Correlation between the promoter activity of transfected fragments and the expression of endogenous Ly49 genes.
The data summarizes the cell lines of various types (T, T cell; NK, NK cell, Mph, macrophage; DC, dendritic cell; Mast, mast cell; B, B cell) that were examined in this study for the expression of Ly49 mRNA transcripts and that were transfected with pGL4-luciferase plasmids containing the various upstream fragments (FM, PM, uE2, and Full) described in detail elsewhere in this manuscript. The level of expression is shown as: ++, high; +, clearly detectable; −, marginal or undetectable; nd, not determined. Green boxes highlight situations where promoter activity was detected in cells that lacked expression of the corresponding endogenous gene. Red boxes highlight situations where promoter activity was marginal or undetectable in cells that expressed the endogenous gene.

