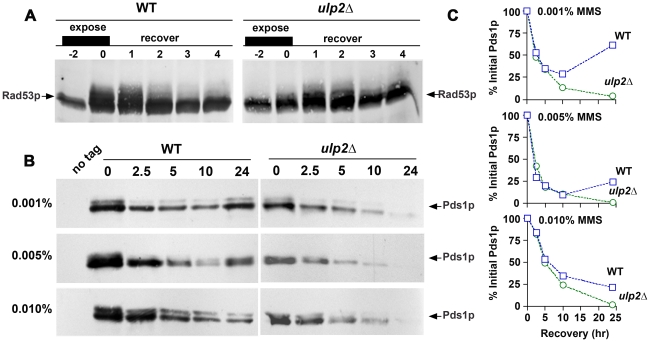
Figure 5. ulp2Δ mutants terminate checkpoint signaling and commit to anaphase after MMS treatment.
(A) Rad53p activation/de-activation. WT (CRY1) and ulp2Δ (JBY240) mutants were synchronized in G1 using mating pheromone, then released into media containing 0.01% MMS (−2 hr time point). After a 2 hr MMS treatment (0 hr time point) cells were allowed to recover in MMS-free media, and mating pheromone was restored to re-arrest cells in the next G1. Protein samples were analyzed by α-Rad53p immunoblotting to monitor phospho-electrophoretic mobility variants of Rad53p. (B) Pds1p degradation. cdc14-1 (MLY181) and cdc14-1 ulp2Δ (MLY183) PDS1-myc strains were grown to logarithmic phase at 23°C and then washed into media containing either 0.001%, 0.005%, or 0.01% MMS. After a 2 hr MMS treatment, cells were washed into MMS-free media (0 time point) and shifted to 35°C to inactivate cdc14-1, thereby blocking mitotic exit after cells recovered from MMS. Protein extracts were prepared at the indicated times, protein concentrations were quantified, and equal amounts of protein were fractionated on SDS-PAGE gels. Pds1p-myc abundance was examined by α-myc immunoblotting. Ponceau staining was used to confirm equivalency of protein load (not shown). A protein sample from a mid-logarithmic phase culture of a WT strain (CRY1) was used as a no-tag control. (C) The gel analysis tools of NIH Image J were used to quantify the Pds1p bands shown in (B). Values were normalized to the 0 time point and expressed as a percent. WT (squares); ulp2Δ (circles).

