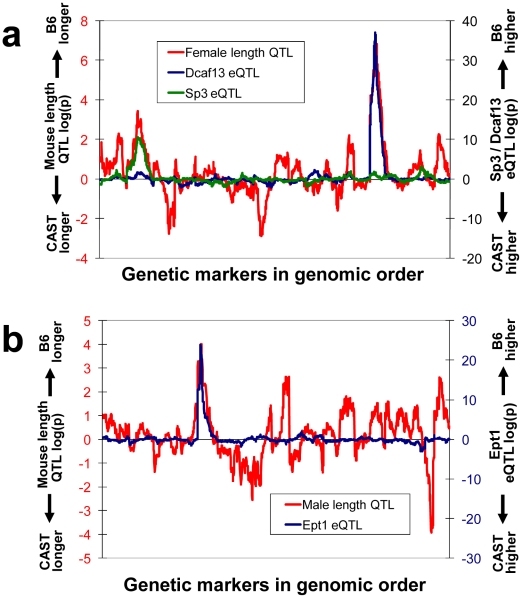
Figure 4. Overlap between morphological and expression QTLs.
(a) QTL scan for naso-anal length of CxB females is shown in red, where the magnitude of the log10 of the trait/genotype regression p-value is plotted for each of 1,438 genetic markers (in genomic order, starting with chromosome 1). Positive values indicate the B6 allele is associated with longer mice, while negative values indicate the opposite (scale is to the left). The blue and green lines are analogous, where the traits are expression of two growth-related genes, Dcaf13 and Sp3, in CxB female brain; positive values indicate the B6 allele up-regulates expression, while negative values indicate the opposite (scale is to the right). (b) As in part (a), except for male mice, and eQTL data are shown for another growth-related gene, Ept1 (in CxB male brain).

