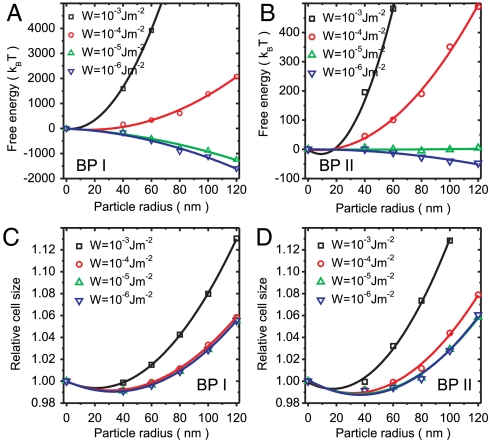
Fig. 4.
Free energy profile for various particle sizes and anchoring strengths W in (A) BP I FCC colloidal crystals and (B) BP II BCC colloidal crystals. Relative unit cell sizes for various particle sizes and anchoring strengths of (C) BP I FCC colloidal crystal and (D) BP II BCC colloidal crystal. Particle radius r = 0 corresponds to BP with no particles. Free energy and relative cell size profiles for W = 10-6 J/m2 change for less than 2% and 0.01%, respectively, upon further decreasing the anchoring strength (W → 0).

