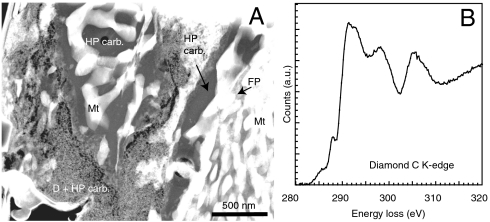
Fig. 3.
(A) TEM image of the recovered sample from the ferropericlase + CO2 experiment. Magnetite (Mt), high-pressure carbon-bearing phase (HP carb.), ferropericlase (FP), and nanodiamonds (D) are present. (B) C K-edge EELS spectrum of nanodiamonds observed in the recovered sample. The spectrum presents the absorption edge at 289 eV and the dip at 303 eV is characteristic of diamond C K-edge (38, 39).

