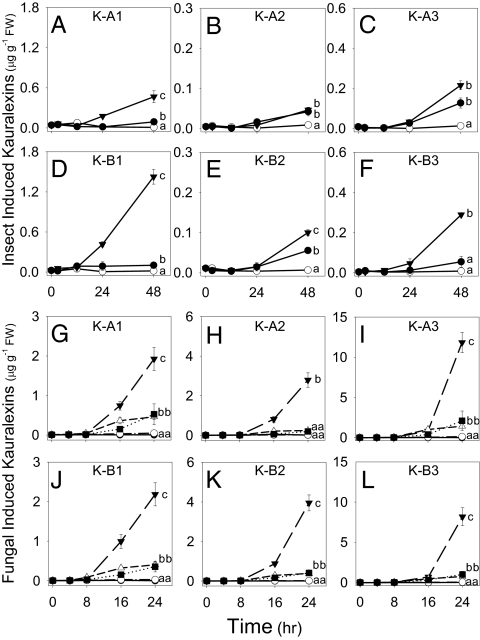
Fig. 2.
Insect and fungal attack rapidly induces kauralexin concentrations. Average (n = 3, ±SEM) induced kauralexin A1 (A), A2 (B), A3 (C), B1 (D), B2 (E), and B3 (F) concentrations in maize stems experiencing no treatment (○), mechanical damage (●), and O. nubilalis herbivory (▼). Average (n = 4, ±SEM) induced kauralexin A1 (G), A2 (H), A3 (I), B1 (J), B2 (K), and B3 (L) concentrations in control maize stems (○) or those treated with a combination of damage plus H2O (●), pectinase elicitor (■), C. graminicola spores (△), or R. microsporus spores (▼). Because of the similarity between control/damage + H2O and pectinase/C. graminicola treatments, plot symbols are partly obscured. Within plots, different letters (a–c) represent significant differences at final time points (P < 0.01 for all ANOVAs; P < 0.05 for Tukey test corrections for multiple comparisons).

