Fig. 1.
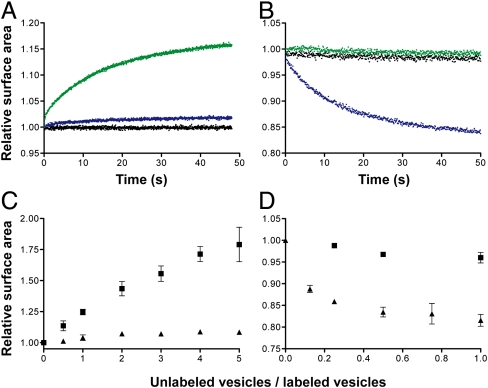
Phospholipids drive competition between fatty acid vesicles. (A and B) Competition between vesicles was monitored by a FRET-based real-time surface area assay. Growth of FRET-labeled 90∶10 oleate∶DOPA vesicles (A) and shrinkage of FRET-dye labeled oleate vesicles (B) when mixed 1∶1 with buffer (black), unlabeled oleate vesicles (green), or unlabeled 90∶10 oleate∶DOPA vesicles (blue). (C and D) The dependence of vesicle growth or shrinkage on vesicle stoichiometry. Final growth after equilibrium of FRET-labeled 90∶10 oleate∶DOPA vesicles (C) and shrinkage of FRET-labeled oleate vesicles (D) when mixed with varying amounts of unlabeled oleate (▪) or unlabeled 90∶10 oleate∶DOPA (▴) vesicles. Error bars indicate SEM (N = 3).

