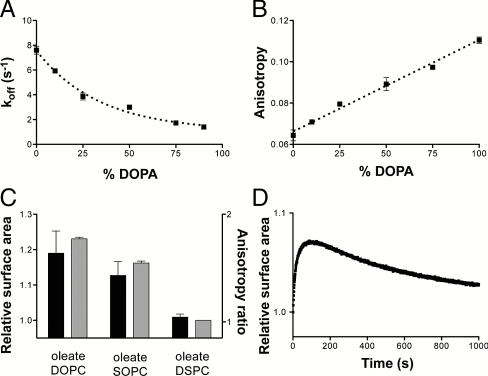
Fig. 3.
Mechanisms of phospholipid-driven growth. (A) The desorption rate of oleate in mixed oleate/DOPA vesicles as a function of DOPA content. Increasing phospholipid content slows oleate desorption, leading to growth of phospholipid-enriched vesicles. (B) The steady-state anisotropy of DPH in oleate/DOPA vesicles as a function of DOPA content. Bilayer packing order increases linearly with increasing fraction of the diacyl lipid. Dashed line indicates linear regression fit, R2 = 0.98. (C) The extent of growth of FRET labeled 90∶10 oleate∶DSPC vesicles when mixed 1∶1 with the given 90∶10 vesicle composition (black bars, left axis) correlates with the ratio of the membrane fluidity between oleate/DSPC bilayers and those of the given composition as measured by DPH anisotropy (gray bars, right axis). DOPC, di-oleoyl-phosphocholine (C18∶1); SOPC, 1-stearoyl-2-oleoyl-phosphocholine (C18∶0/C18∶1). (D) Growth of FRET-labeled 90∶10 oleate∶NA vesicles when mixed 1∶1 with unlabeled oleate vesicles. Growth proceeds in the first 60 s, followed by a slow relaxation due to the equilibration of the slowly exchanging NA fraction. Error bars indicate SEM (N = 3).

