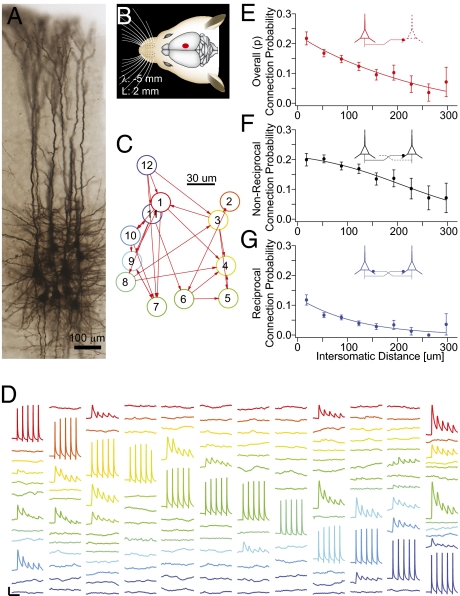
Fig. 1.
Pair-wise connectivity. (A) Morphological staining of a cluster of 12 cells recorded simultaneously. (B) Region of the somatosensory cortex where recordings were carried out. (C) Connectivity diagram of neurons in D. (D) Example of recorded traces in an experimental session. A different neuron is stimulated and the responses of the remaining neurons were recorded (displayed in columns). [Scale bars: horizontal, 100 ms; vertical, 1 mV (15 mV for action potentials)]. (E–G) Connection probability profiles as a function of distance. Error bars represent SEM.

