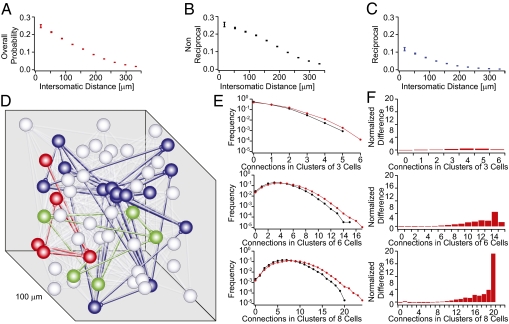
Fig. 5.
Simulation of clustered connectivity. (A–C) Connection probabilities in reorganized network that reflect the function of distance as found in the experimental data. (D) Three clusters (red, green, and blue) identified with affinity propagation in a network of 2,028 neurons. (E and F) Properties of simulated networks that reflect experimental measurements shown in Fig. 2 when comparing the initial network (black) and its reorganized version (red). Error bars represent SEM.

