Fig. 3.
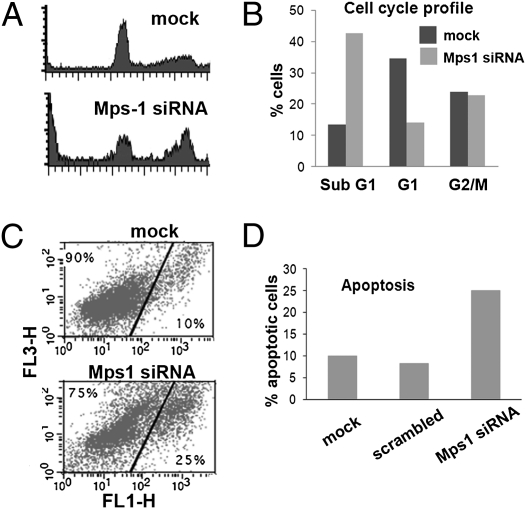
Induction of apoptosis by reductions in Mps1 levels. (A) Flow cytometry measurements of cell-cycle distribution of propidium iodide-stained T47D cells. Cultures treated with Mps-1 siRNA for 3 d are compared with cells treated with the same transfection reagents but no siRNA vector (mock) (B) Plots showing distribution of T47D cells in sub-G1, G0/G1, and G2/M phase compartments. (C) Staining for propidium iodide (vertical axis) and Annexin V (horizontal axis) in T47D cells that are mock treated (Upper) or treated with Mps1 siRNA (Lower). Only nonnecrotic cells (without high PI staining) are shown. Cells with increased Annexin V staining are scored as apoptotic. Treatment of cells with scrambled sequence resulted in staining similar to mock treated. (D) Histogram comparing the percent of apoptotic cells in each of the different treatments.

