Fig. 3.
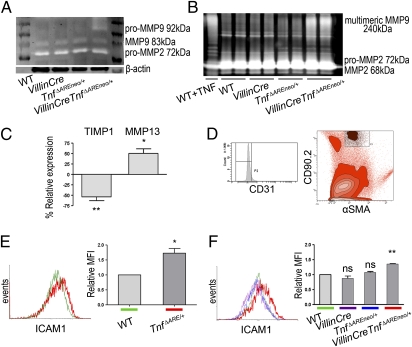
Early activation of IMF in the ileum of VillinCreTnfΔAREneo/+ mice. (A) Gelatin zymogram showing MMP9 and MMP2 activity in whole-tissue extracts from the ileum of VillinCreTnfΔAREneo/+ and littermate control mice at age 2 mo. Lines represent individual mice. Data shown are representative of three independent experiments. (B) Gelatin zymogram showing MMP9 and MMP2 secretion from IMF isolated from VillinCreTnfΔAREneo/+ mice (n = 4) and littermates (n = 4 each) at age 2 mo. Lines represent duplicates of separate samples within a single experiment. WT IMF treated with TNF were used as positive control. Data are representative of two independent experiments. (C) Quantitative RT-PCR analysis for TIMP1 (**P < 0.01) and MMP13 (*P < 0.05) expression in IMF isolated from 2-mo-old VillinCreTnfΔAREneo/+ mice and the respective controls in three independent experiments. One sample t test was performed for statistical significance. Error bars show SD. (D) Discrimination of IMF (CD90.2+αSMA+CD31− cells) among intestinal cell populations by FACS analysis. (E and F) ICAM1 expression measured on gated freshly isolated IMF. Analysis was performed in pooled tissues from WT (n = 3) and TnfΔARE/+ (n = 3) 4-wk-old mice in three independent experiments (*P < 0.05) (E) and WT (n = 3), VillinCre (n = 3), TnfΔAREneo/+ (n = 3), and VillinCreTnfΔAREneo/+ (n = 3) 2-mo-old mice in three independent experiments (**P < 0.01) (F). One sample t test was performed for statistical significance. Error bars show SD. MFI, mean fluorescence intensity.

