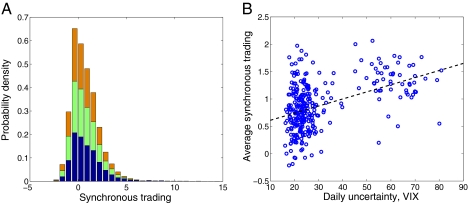
Fig. 2.
Synchronous trading and uncertainty. (A) The probability density for synchronous trading sij (bottom blue bars), advanced trading  (middle green bars), and delayed trading
  (top orange bars) for all traders across the observation period. The bar size is the sum of the three probability values, and colors correspond to the relative contribution each distribution makes to the total sum. We found that synchronous trading is significantly different from advanced and delayed trading (P < 10−3 using the Kolmogorov–Smirnov test). (B) The positive association (P < 10−4 using Markov randomizations) between the average synchronous trading
  and level of daily uncertainty in the market, given by the market’s standard volatility index (VIX) (17). The dashed line depicts the relationship estimated via a linear regression.

