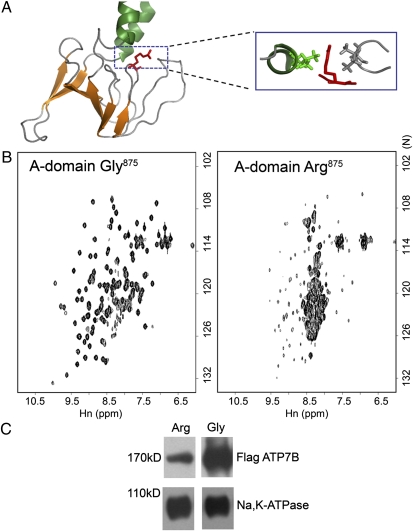
Fig. 5.
Unfolding of the A-domain correlates with the decreased levels of ATP7B-Arg875 in cells. (A) Structure of the A-domain (13) with Arg replacing Gly875 (red). The box shows the position of the Arg side chain with respect to neighboring residues (green and gray). (B) 1H,15N-HSQC spectra of the Gly875 or Arg875-containing A-domain at 27 °C. (C) Western blot of membrane preparations from HEK293Trex cells transfected with the Flag-ATP7B Gly875 or Arg875 variant. Staining for anti-FLAG antibody (Upper) and for Na,K-ATPase (Lower), used as a loading control, is shown.

