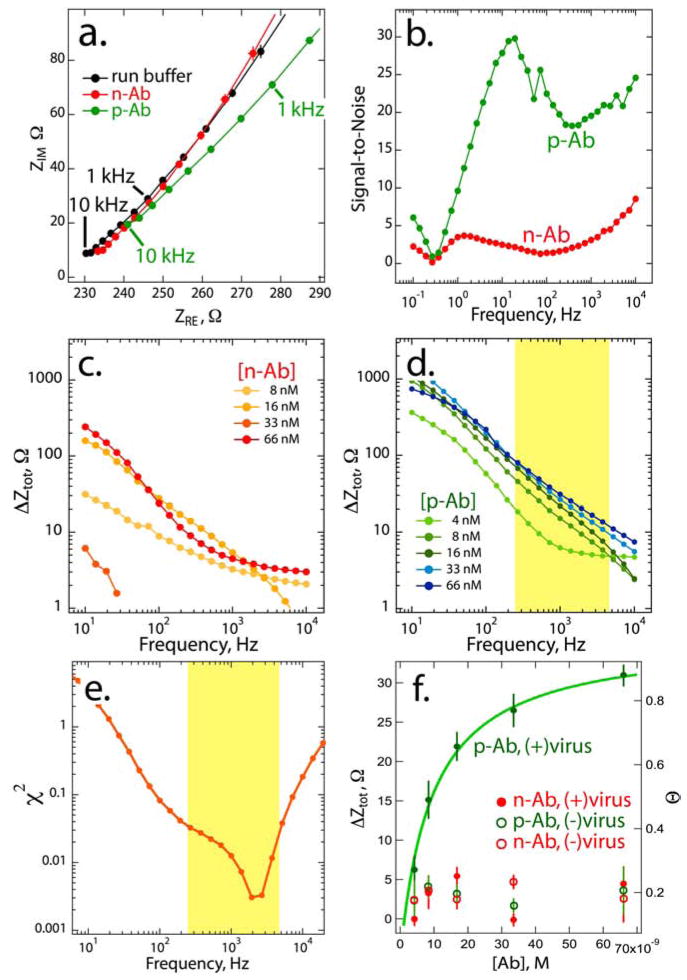
Figure 2.
(a) Nyquist plots for a phage-PEDOT film (thickness ≈1.2 μm) immersed in PBF buffer (black) and PBF buffer + [p-Ab] = 66 nM (green) and PBF buffer + [n-Ab] = 66 nM (red). Five impedance measurements in each solution were averaged to obtain each curve; error bars, obscured by the data points in some cases, indicate ±1σ. (b) Plot of the signal-to-noise ratio, defined as ΔZtot/σ, versus frequency. [p-Ab] = [n-Ab] = 66 nM. (c,d) Log-log plots of ΔZtot versus frequency for a series of p-Ab (c) and n-Ab (d) concentrations ranging from 4 nM to 66 nM. In (d), the yellow interval indicates frequencies where ΔZtot increases monotonically with [p-Ab]. (e). χ2 versus frequency for the fit of a Langmuir isotherm to the ΔZtot versus [p-Ab] data shown in (d). The minimum of this plot, corresponding to the best fit, is observed at 2-3 kHz. (f) Plot of ΔZtotal versus concentration for a PEDOT film containing M13, labeled (+) virus, and a second film containing no virus, labeled (−) virus. These two films were exposed to both n-Ab and p-Ab at the indicated concentrations. Impedance data for p-Ab exposures at the virus-PEDOT composite film are fitted with a Langmuir isotherm.

