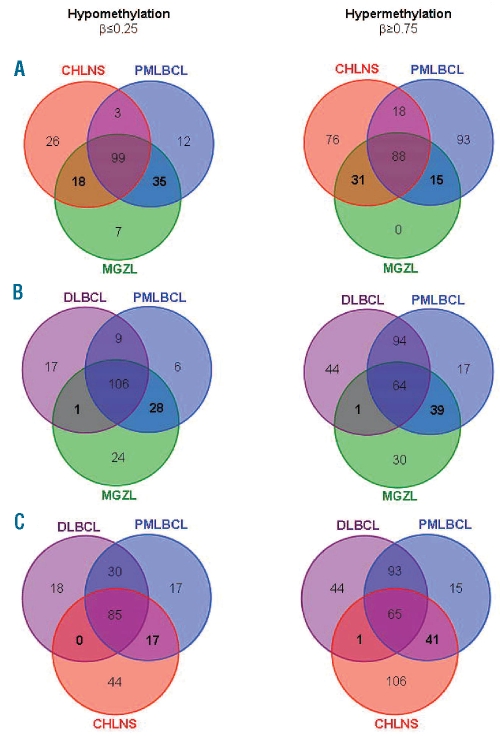
Figure 3.
CpG target hypomethylation and hypermethylation in MGZL, CHLNS, PMLBCL and DLBCL. The Venn diagrams show the numbers of common hypomethylated (β≤0.25) targets (left hand panels) or common hypermethylated (β≥0.75) targets (right hand panels) in the indicated lymphoma entities. Comparison of MGZL with CHLNS and PMLBCL (A) or DLBCL and PMLBCL (B) and comparison of CHLNS with DLBCL and PMLBCL (C). (A) MGZL shares a number of unique common hypo- and hypermethylated targets with CHLNS and PMLBCL (numbers in bold). (B) In contrast, only one hypomethylated and one hypermethylated target are shared between MGZL and DLBCL, exclusive of those shared by PMLBCL. Several hypomethylated and hypermethylated targets are shared in common by MGZL and PMLBCL but not shared by DLBCL, 28 and 39 respectively (numbers in bold). (C) Some overlap of target methylation is present between CHLNS and PMLBCL (17 hypomethylated CpG, 41 hypermethylated CpG) but almost none between CHLNS and DLBCL (numbers in bold).

