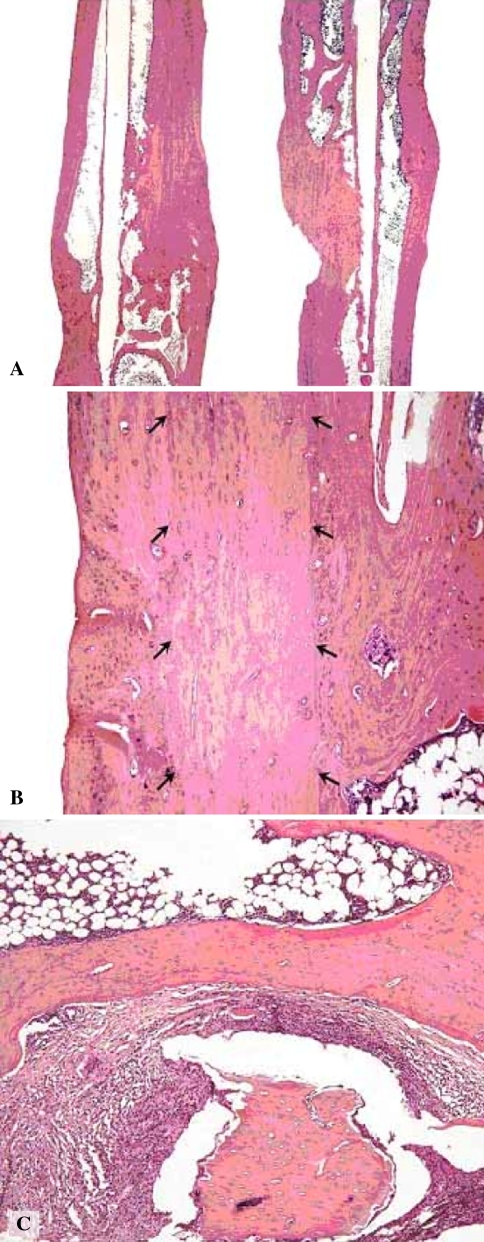
Fig. 2A–C.
(A) A low-power photomicrograph is shown that includes the area of the graft, a bone with allogeneic graft on the left, and a syngeneic graft on the right. Both bones show ++ bone continuity (Stain, hematoxylin & eosin). Scale bar = 1.5 mm. (B) A medium-power photomicrograph shows an area with remnant of the graft outlined with arrows. The micrograph is from a bone with ++ remnants of implant (Stain, hematoxylin & eosin). Scale bar = 200 μm. (C) Another medium-power photomicrograph shows an area of bone marrow with dead bone (rounded structure in the lower middle of the photomicrograph) surrounded by inflammatory infiltrate and fibrosis. This is from a + inflammation bone (Stain, hematoxylin & eosin). Scale bar = 200 μm.

