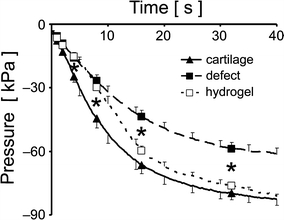
Figure 3.

Pressure vs. time curves for intact cartilage, osteochondral defects, and defects filled with hydrogel, n = 10. Triangle and square markers indicate the 1, 2, 4, 8, 16, and 32 s time points that were analyzed. * p < 0.05 difference between groups above and below the asterisk
