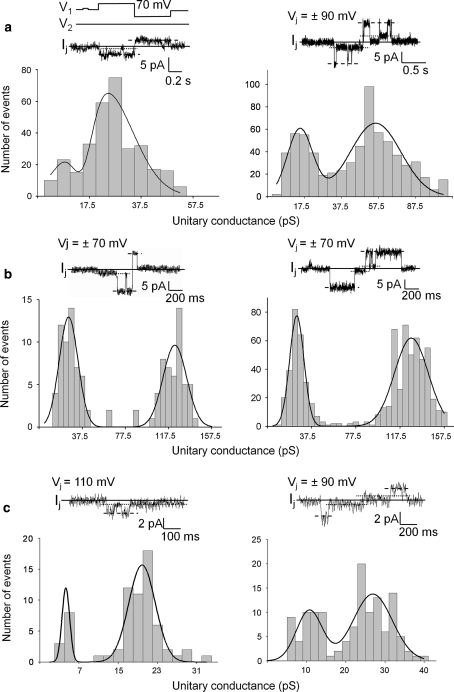
Fig. 6.
Homotypic cell pairs: single-channel conductance. Data of cell pairs with tagged Cxs (left) and wild-type Cxs (right). Upper panels Pulse protocol (V 1, V 2) and current signal, I j. Solid line Zero current level. Pointed line Channel residual state. Dashed line Channel main state. Lower panels Frequency histogram of channel conductances. Curves reflect best fit of data to the sum of two gaussians; peaks to the left and right correspond to the mean conductance of the residual state, γj,residual, and main state, γj,main, respectively. a Cx43 channels, bin width 5 pS. b Cx40 channels, bin width 5 pS. c Cx45 channels, bin width 2 pS (smaller values require a narrower bin width)

