
Figure 3.
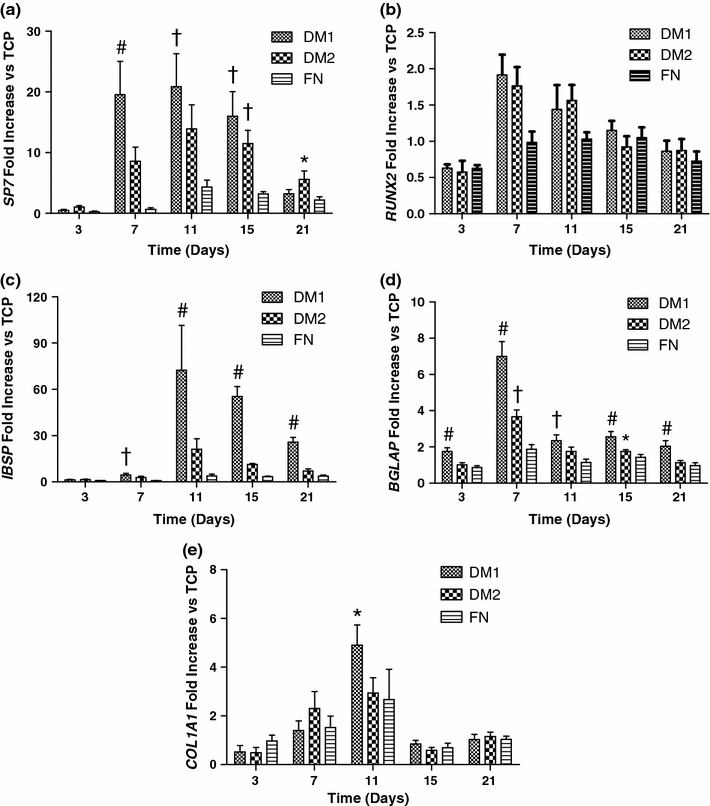
DM1 enhanced expression of several ostegenic marker genes in hMSCs compared to DM2 or control substrates when probed by qPCR in hMSCs cultured on each substrate for 3–21 days: (a) SP7, (b) IBSP, (c) RUNX2, (d) BGLAP (osteocalcin), and (e) COL1A1. Data were normalized to MRPL13 transcript level and reported as fold change in mRNA expression vs. TCP controls. # p < 0.05 vs. all groups, † p < 0.05 vs. FN and TCP, *p < 0.05 vs. TCP only (n = 3)