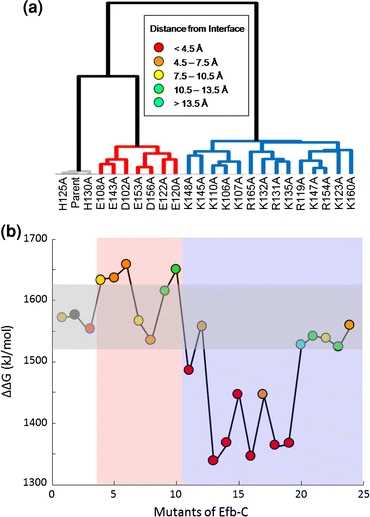
FIGURE 3.

Clustering and free energy results for C3d–EfbC. (a) Clustering of EfbC mutants at 0 mM ion concentration and εP = 2. The color of the line to each mutant in the dendrogram indicates the type of mutation. Mutations of positive amino acids are in blue, mutations of negative amino acids are in red, and mutations of neutral amino acids are in gray. (b) Free energy (ΔΔG solvation) values of C3d–EfbC complex mutants at 0 mM ion concentration and εP = 2. The white, red, and blue vertical regions correspond to the line coloring of (a). The colored circles within the plot represent the distance of each amino acid to C3d, as indicated in the legend. The black circle represents the parent complex. A horizontal shaded box indicates mutations with a free energy value of ±50 kJ/mol of the parent
