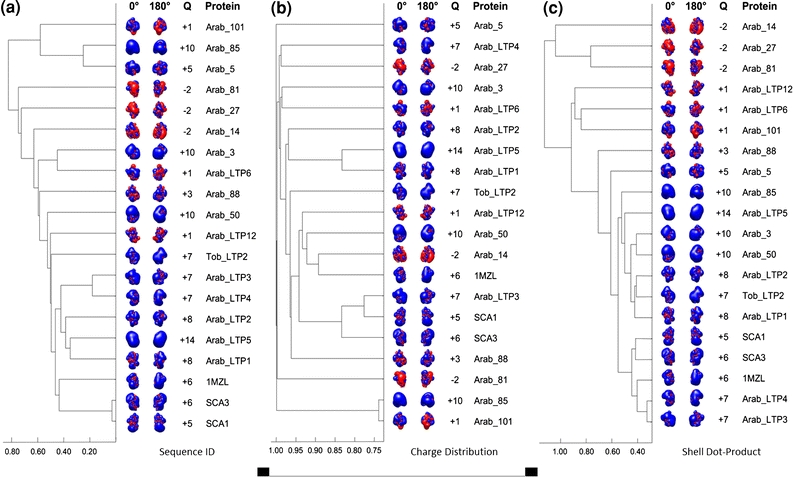
FIGURE 4.

Dendrograms for the clustering of 20 LTP/LTP-like proteins based on (a) sequence identity; (b) charge distribution; and (c) ESD Shell–DP. Electrostatic potentials were calculated using ionic strengths corresponding to 50 mM ion concentration and εP = 2. Isopotential contours at two axial rotations are included for each LTP/LTP-like protein. The color code for the isopotential contours is blue for positive and red for negative electrostatic potential. Isopotential contours are plotted at ±1 k B T/e
