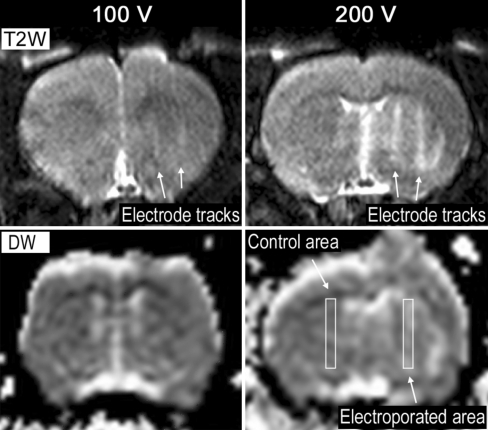
Fig. 4.
Top T2-weighted (T2W) transaxial image of rat brain showing the electrode tracks from two electrodes after right hemisphere EP, acquired about 10 min after EP. The EP area is defined as the region between the electrode tracks. The left hemisphere was used as a control area and, as expected, showed no reaction for either voltage condition. Bottom mapping of the derived ADCs: bright areas correspond to higher diffusion coefficients, darker areas correspond to lower diffusion coefficients. Rectangular areas outline the EP area (between the electrode tracks shown in the T2-weighted image) and the control area in the contralateral hemisphere, respectively. ADCs correspond to measurements about 14 min after EP

