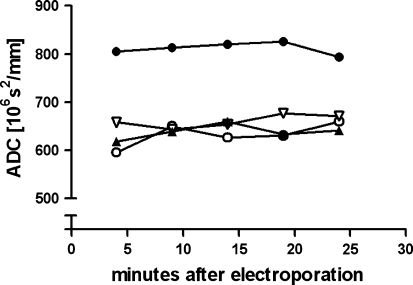
Fig. 5.
The ADC of different regions in the brain at different time points after EP using the high-voltage condition (200 V/cm). The EP region (filled circle) shows a significantly higher ADC compared to the electrode track regions (filled triangle and empty triangle) and the contralateral hemisphere (empty circle). Data are for one animal. SD ≈ 100 of each data point

