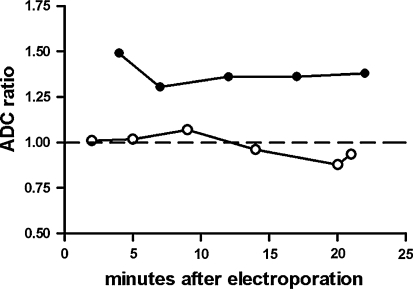
Fig. 6.
The ADC change over time for the 100 V (empty circle) and 200 V (filled circle) conditions. The ADC ratio is defined as the ADC of the EP region divided by the ADC of the control region in the contralateral hemisphere. Data are for one animal in each voltage condition. SD ≈ 0.15 of each graph point

