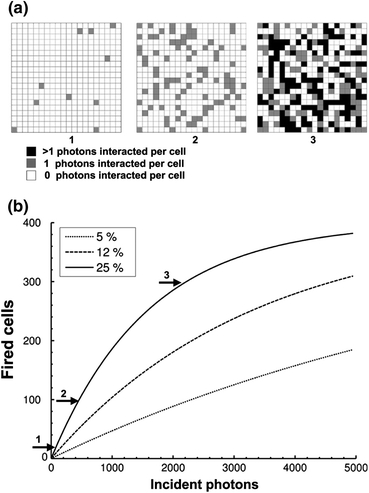
Figure 7.

(a) Representation of a 400-cell SiPM at different light levels that results in (from left to right) 10, 100 and 300 cells firing. The grey scale indicates the number of photons interacting per cell and was calculated from Eq. (3), for a PDE of 25%. (b) Number of fired cells vs. number of incident photons: illustration of Eq. (3) for a SiPM with 400 cells and different PDE values (5, 12, and 25%)
