
Figure 5.
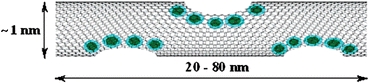
Pictorial representation of Gd3+ ions ( ) within the sidewall defects of a nanotube. Gd clusters measure roughly 1 × 5 nm with 3–10 Gd3+ ions per cluster. Graphic from Fig. 1 in Hartman et al.
37
) within the sidewall defects of a nanotube. Gd clusters measure roughly 1 × 5 nm with 3–10 Gd3+ ions per cluster. Graphic from Fig. 1 in Hartman et al.
37
Official websites use .gov
A
.gov website belongs to an official
government organization in the United States.
Secure .gov websites use HTTPS
A lock (
) or https:// means you've safely
connected to the .gov website. Share sensitive
information only on official, secure websites.
Pictorial representation of Gd3+ ions (
) within the sidewall defects of a nanotube. Gd clusters measure roughly 1 × 5 nm with 3–10 Gd3+ ions per cluster. Graphic from Fig. 1 in Hartman et al.
37