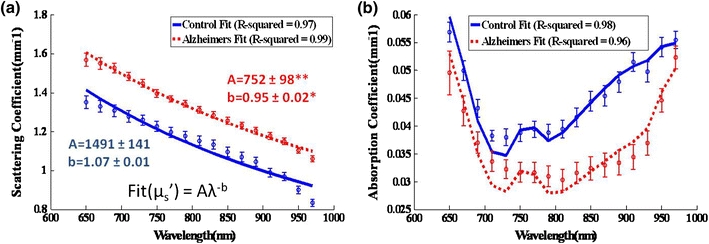
Figure 3.

(a) Reduced scattering and (b) absorption spectra (group average ± group SE shown) were fit to the Mie scattering power law  and for hemoglobin and water chromophores, respectively, with a least squares linear fit and R
2 values were found. *p < 0.005, **p < 0.001
