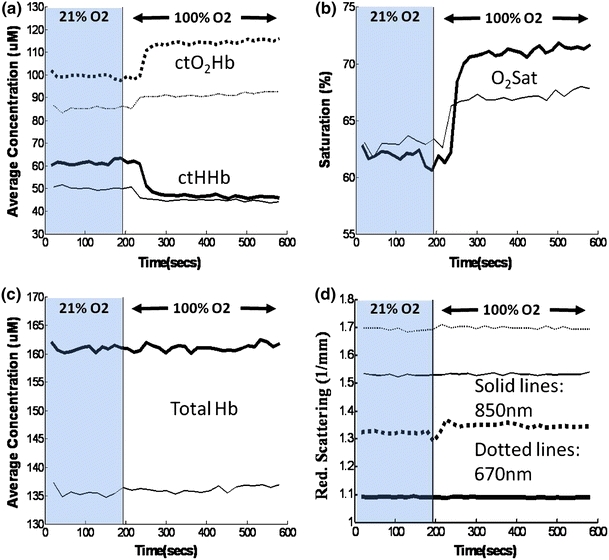
Figure 4.

Representative dynamic time courses in Alzheimer’s (thin lines) and control mice (thick lines) of (a) oxy-hemoglobin (ctO2Hb, dotted lines) and deoxy-hemoglobin (ctHHb, continuous lines), (b) oxygen saturation (O2 sat), (c) total hemoglobin (Total Hb), and (d) reduced scattering coefficient at 670 nm (dotted lines) and 850 nm (continuous lines)
