Fig. 3.
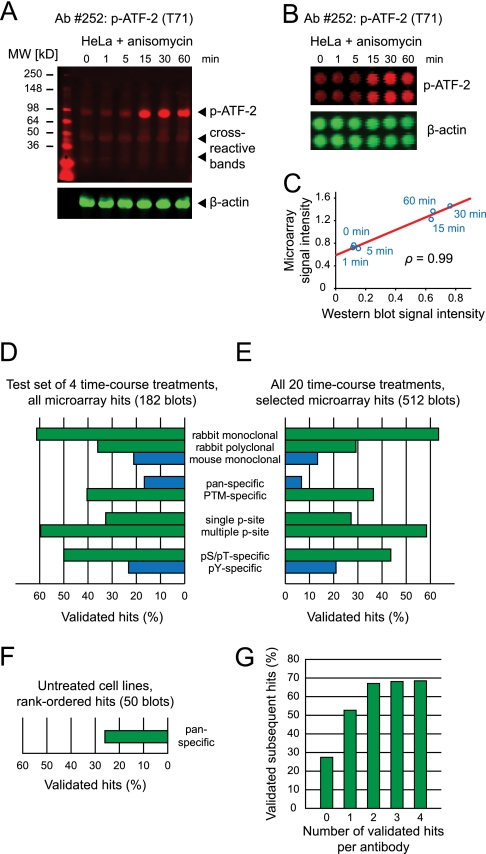
Secondary validation by quantitative immunoblotting reveals key determinants of antibody performance. A, Representative Western blot, showing moderate cross-reactivity. Lysates of HeLa cells treated with anisomycin, simultaneously probed with an antiphospho-ATF-2 (T71) antibody (red) and an anti-β-actin antibody (green). β-actin intensity was used to normalize signals for differences in gel loading. B, Lysate microarray images using the same lysates and antibodies as in (A). C, Scatter plot of signal intensities from (A) and (B) reveals degree of correlation between microarray and Western blotting data. D, Determinants of antibody reactivity, derived from an exhaustive Western blotting validation of microarray hits across four time course treatments (A431 + EGF, HT-29 + insulin, HeLa + anisomycin, and HeLa + TNFα). Blue: mouse antibodies, pan-specific antibodies, and pTyr-detecting antibodies generally exhibited lower validation rates. Green: rabbit, PTM-specific, and pSer/pThr-specific antibodies generally showed higher rates of validation. E, Determinants of antibody reactivity, derived from Western blotting validation of a subset of microarray hits across all time course treatments. Results were similar to (D). F, Validation rate of pan-specific antibodies across untreated cell lines. G, Prior validation of an antibody in one or more biological contexts increases the probability that it will perform well in additional biological contexts.

