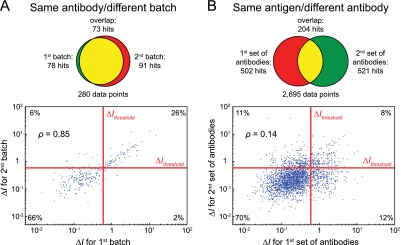
Fig. 4.
Microarray reactivity is antibody-dependent, but not batch- or antigen-dependent. A, Comparison of microarray data using different batches of the same antibodies. Top: Venn diagram showing substantial overlap between microarray hits. Bottom: Scatter plot of signal spreads (ΔI) across all time course microarray data, showing high degree of correlation. Data are represented on a double-logarithmic scale for ease of visualization. B, Comparison of microarray data from different antibodies directed at the same antigens, showing minimal overlap of hits and low degree of correlation. Top and bottom as in (A).

